Blogs
Ecological footprint
Ecological Footprint accounting measures the demand on and supply of nature.
On the demand side, the Ecological Footprint measures the ecological assets that a given population requires to produce the natural resources it consumes (including plant-based food and fiber products, livestock and fish products, timber and other forest products, space for urban infrastructure) and to absorb its waste, especially carbon emissions.
The Ecological Footprint tracks the use of six categories of productive surface areas: cropland, grazing land, fishing grounds, built-up land, forest area, and carbon demand on land.
On the supply side, a city, state or nation’s biocapacity represents the productivity of its ecological assets (including cropland, grazing land, forest land, fishing grounds, and built-up land). These areas, especially if left unharvested, can also absorb much of the waste we generate, especially our carbon emissions.
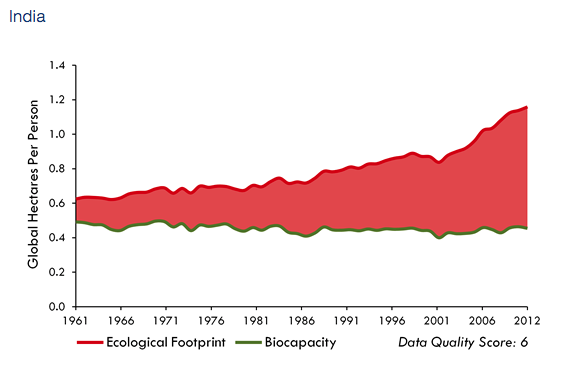
This is India's ecological footprint vs Biocapacity chart till 2012

“There are only 15.71 global hectares available per person on a renewable basis. Currently, we are overshooting the Earth’s biological capacity by nearly 50%. To sustain present levels of consumption, we would need 1.5 Earths.”
Water footprint
“When the well is dry, we know the worth of water.”
India has about 16% of the world's population but only4% of its water resources, according to a UNICEF Report titled Water in India: Situation and Prospects. The path to development demands more of this precious resource at an alarming rate. The Millennium Development Goals (MDGs), through its eight international development goals, greatly emphasize the need for sustainable access to safe drinking water as well as sanitation.
A water footprint helps one understand the amount of water being used at an individual level all the way to a national level and in the numerous processes involved in manufacturing and producing our goods and services.
- India's water footprint while India's water footprint — 980 cubic meters per capita – ranks below the global average of 1,243 cubic meters, its 1.2 billion people collectively contribute to a significant 12% of the world's total water footprint.:

- Waterfoot print of India compared to other countries


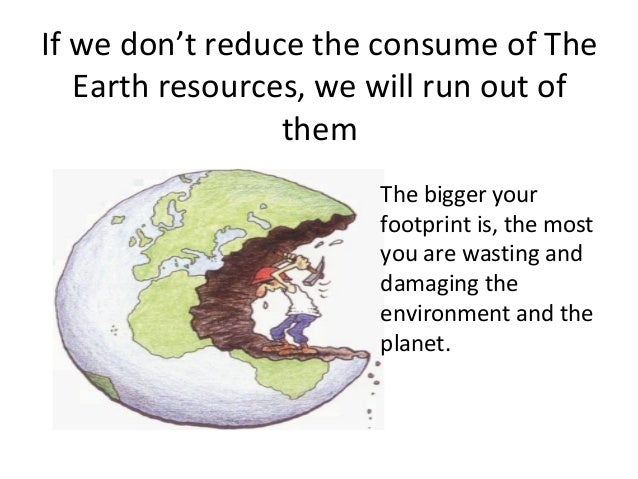
The last messages I want to give you by this image is for ecological footprint

Post comment
1 Comment(s)
Good work

Mohammed Ikram Hyderi
Aug 23, 2017