Blogs
The ecological footprint measures human demand on nature, i.e., the quantity of nature it takes to support people or an economy. It tracks this demand through an ecological accounting system. The accounts contrast the biologically productive area people use for their consumption to the biologically productive area available within a region or the world (biocapacity). In short, it is a measure of human impact on Earth's ecosystem and reveals the dependence of the human economy on natural capital.
The ecological footprint is defined as the biologically productive area needed to provide for everything people use: fruits and vegetables, fish, wood, fibers, absorption of carbon dioxide from fossil fuel use, and space for buildings and roads. Biocapacity is the productive area that can regenerate what people demand from nature.
Footprint and biocapacity can be compared at the individual, regional, national or global scale. Both footprint and biocapacity change every year with number of people, per person consumption, efficiency of production, and productivity of ecosystems.At a global scale, footprint assessments show how big humanity's demand is compared to what planet Earth can renew. Global Footprint Network calculates the ecological footprint from UN and other data for the world as a whole and for over 200 nations. They estimate that as of 2013, humanity has been using natural capital 1.6 times as fast as nature can renew it.

AS we can see India has comparatively less ecological deficit than Algeria which is a positive sign for us and the increase in bio-capacity/economical reserve is a sign of India growing towards being a superpower.
Water footprint:
Water use is the amount of water used by a household or a country, or the amount used for a given task or for the production of a given quantity quantity of some product or crop, or the amount allocated for a particular purpose.
The water footprint measures the amount of water used to produce each of the goods and services we use. It can be measured for a single process, such as growing rice; for a product, such as a pair of jeans; for the fuel we put into our car; or for an entire multi-national company. The water footprint can also tell us how much water is being consumed by a particular country-or globally-in a specific river basin or from an aquifer.
The average water footprint of a person living in India is 593 m³.
Carbon footprint:
Comparing to the richness of a country,the carbon footprint roughly increases with richness(exceptions include Russia, where most of the carbon footprint comes from natural sources like volcanoes).Here's some examples;
Country Luxembourg UAE USA UK Russia India Somalia Zimbabwe
GDP per capita $102,000 $68,000 $56,000 $39,000 $8750 $1700 $434 $1000
Carbon footprint (per capita) 22.8 20 28.3 15.4 3.3 1.9 0.013 3.9
India is a country which is still developing, which means the carbon footprint is increasing rapidly. It is soon going to surpass that of developed countries like UK or USA. If we look at the other end of the spectrum, at Luxembourg, which has one of the highest Carbon footprint, we could really see the rich the people are, and how developed the country is.
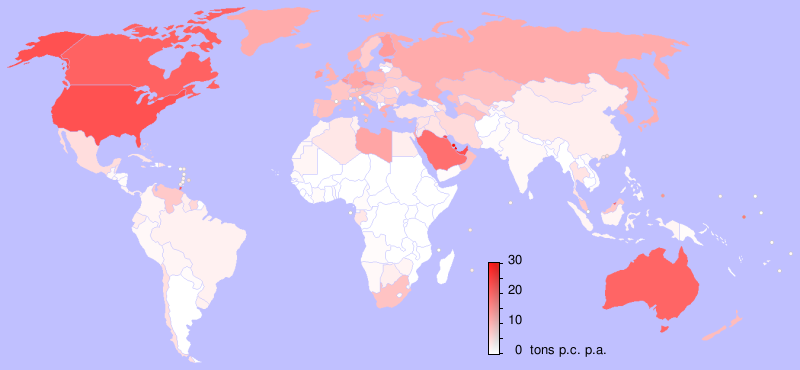
Footprint Map:

Power imbalances are created due to climate change among almost all countries. In countries with more Carbon-Dioxide emissions, there more power imbalances.
Particularly, in India, even the Carbon Footprint per ca-pita is quite low. The emissions are due to to high population (in fact it is higher than that of Australia, Russia and UK which have relatively lower population) and the effects are infinite. There are a lot of power imbalances in two neighbouring countries.Take the countries USA and Mexico (See the map above) where the difference is huge. When one crosses the border between USA and goes to Mexico, one can really see the difference in Climate and power.
